Comflow Custom Chart Setup
Comflow CAGs are created in execution point preDialogOut.
public class PreDialogOut extends AbstractRuleExecute {

    @Override
    protected boolean preDialogOut() {
        CAGPie pie = new CAGPie();
        pie.setTitle("Pie");
        pie.setTitleSize(12);
        pie.addSector(new CAGPieSector("A", 100, "#FF0000"));
        pie.addSector(new CAGPieSector("B", 100));
        pie.addSector(new CAGPieSector("C", 50));
        pie.addSector(new CAGPieSector("D", 10));
        pie.addSector(new CAGPieSector("E", 40));
        pie.addSector(new CAGPieSector("F", 30));
        pie.setColorScheme(ColorUtil.CA_DEFAULT);

        dialogWorkspace.setGraphicComponent("CAG1", pie);

        return true;
    }
}
The preDialogOut pattern is kept for custom charts as well. However, in order to separate CAGs from custom charts, the custom chart classes must implement a marker interface called ChartRenderer. Adding a custom chart in preDialogOut looks like this, where Gauge is the custom chart implementation. Note that we invoke the addChartRenderer method. We will get back to the very implementation of Gauge in the next section.
public class PreDialogOut extends AbstractRuleExecute {

    @Override
    protected boolean preDialogOut() {
        Gauge gauge = new Gauge(125);
        gauge.setTitle("Speed m/s");
        gauge.setMaxValue(350);
        gauge.addColorRange("red", 10, 20);
        gauge.addColorRange("blue", 20, 40);
        gauge.addColorRange("green", 40, 50);
        gauge.addColorRange("orange", 50, 80);

        dialogWorkspace.addChartRenderer("CAG2", gauge);

        return true;
    }
}
In our example, the Gauge implementation is a Java class implementing the ChartRenderer interface and its getChart method. The example is not fully implemented in how it can be parameterized.
public class Gauge implements ChartRenderer {
    private float value;
    private float maxValue = 100;
    private String title = "";
    private int titleSize = 10;
    private String titleColor = "#666666";

    //  Add necessary setters and getters ...

    @Override
    public String getChart(String chartDivId) {
        StringBuffer sb = new StringBuffer();
        sb.append("<script>\n" +
                "require(['chart/plotly.min'], function(Plotly) {\n" +
                "   var data = [\n" +
                "               {\n" +
                "                   domain: {x: [0, 1], y: [0, 1]},\n" +
                "                   value: " + this.value + ",\n" +
                "                   title: {text: '" + this.title + "', font: { size: " + this.titleSize + ", color: '" + this.titleColor + "' }},\n" +
                "                   type: \"indicator\",\n" +
                "                   mode: \"gauge+number\",\n" +
                "                   gauge: {\n" +
                "                               axis: {range: [null, " + this.maxValue + "]},\n");
        if (!colorRanges.isEmpty()) {
            sb.append("                             steps: [\n");
            for (CAGMeterColorRange colorRange : colorRanges) {
                sb.append("                                         {range: [" + colorRange.getStartValue() + ", " + colorRange.getEndValue() + "], color: '" + colorRange.getColor() + "'},\n");
            }
            sb.append("                                    ],\n");
        }
        sb.append("                        }\n" +
                "               }\n" +
                "           ];" +
                "   var layout = { showlegend: false, width: " + this.width + ", height: " + this.height + ", margin: { t: 0, b: 0 } };\n" +
                "   Plotly.newPlot(" + chartDivId + ", data, layout, {displayModeBar: false});" +
                "});\n" +
                "</script>\n");

        return sb.toString();
    }

}
The getChart method gets a chartDivInput string which is the same id set in the preDialogOut rule for each specific chart added to dialogWorkspace. It returns a script string which is added to
the client HTML upon rendering. Our example refers to the Plotly JavaScript chart lib. No matter what chart lib you choose, you need to load the lib as a module using require. The syntax is:
require(['chart/plotly.min'], function(Plotly) { // Put your implementation here});, where 'chart/plotly.min' is the path to your lib starting from the PublicRoot/scripts folder on your web
server and function(Plotly) is a callback function where the in parameter is a reference to your loaded module.
Where to put my lib
In our example we've put the plotly.min.js file under PublicRoot/scripts/chart in our project.
ca_main_custom_scripts.vm
Put a reference to your JavaScript chart lib in a file named ca_main_custom_scripts.vm and put that file in your customer project under PrivateRoot/templates/vm/navigations/html.
<script src="scripts/chart/plotly.min.js"></script>
Putting it all together
Now we have decided for a certain chart lib implementation (plotly.min.js), we have put it under PublicRoot/..., we point to it from our ca_main_custom_scripts.vm file, we have implemented our Gauge which is added in our preDialogOut execution point. What is left is to point out our custom gauge implementation in a CAG segment in a portlet.
Eclipse Preferences
First we open the Eclipse -> Preferences dialog and go to Comflow -> Portlet Designer -> Chart Implementations.
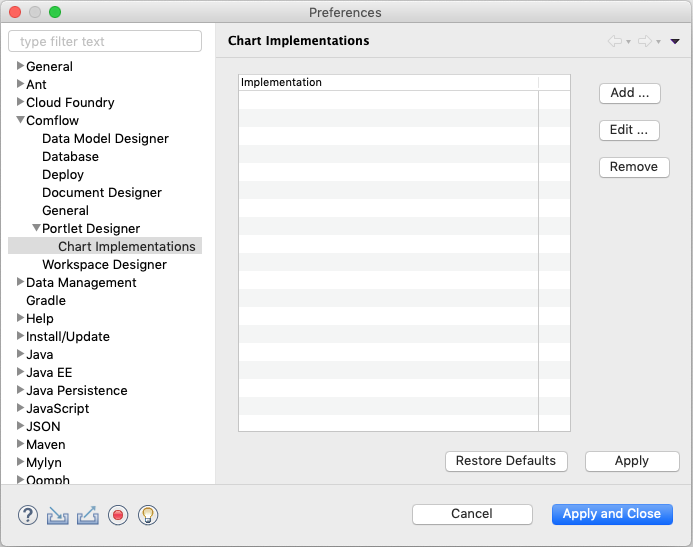
Press the Add ... button.
A dialog opens where you first name your chosen implementation, in our case Plotly.
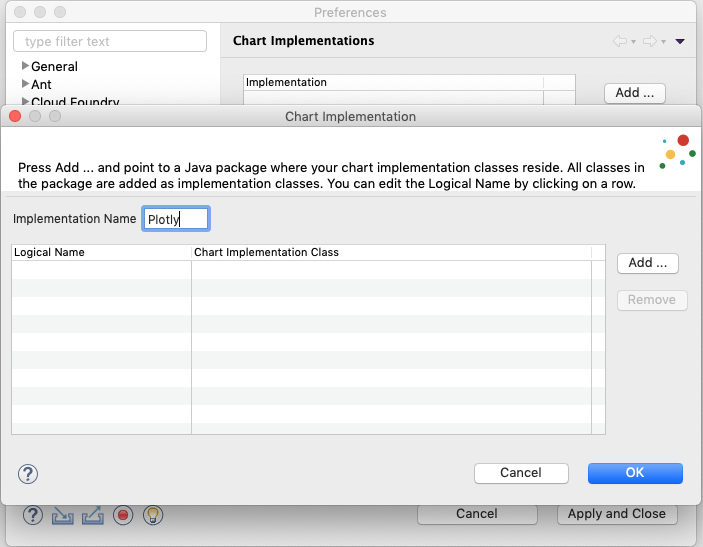
Then you press Add ... and another dialog opens.
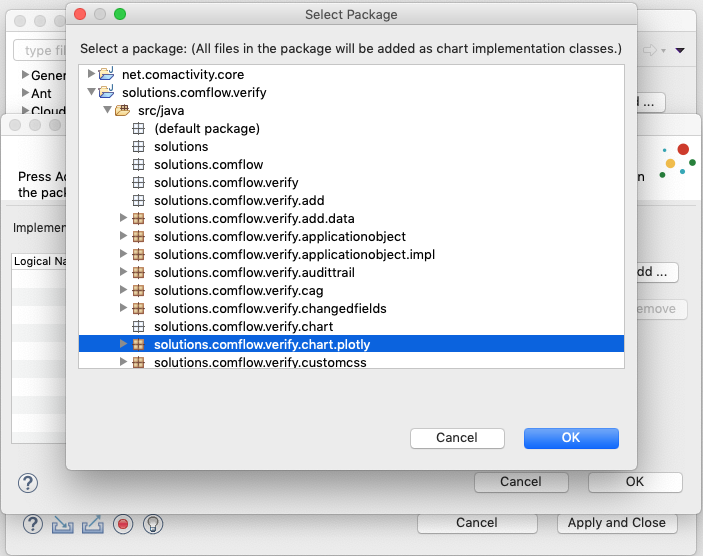
This dialog lists all workspace projects with a Java nature and you can point to any package under the Java source folder. In our example we point to the solutions.comflow.verify.chart.plotly package and press Ok. If you implement different third party chart implementations it is a good idea to separate them in different packages for separation, for instance solutions.comflow.verify.chart.c3. Note! It is assumed that the package you point to only consists of ChartRenderer implementations.
In the pointed out plotly package, there are three different chart implementations namely Gauge, Bar and Pie. The left Logical Name table column suggests the class name as logical name. You can edit the name directly in the table as you wish. These logical names will however show up later on in the CAG segment properties so it is advisory to keep them logical.
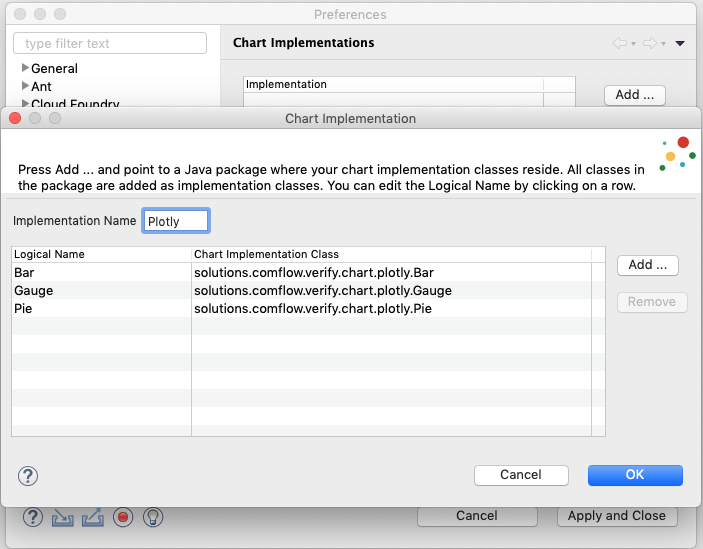
Press Ok.

Press Apply and Close.
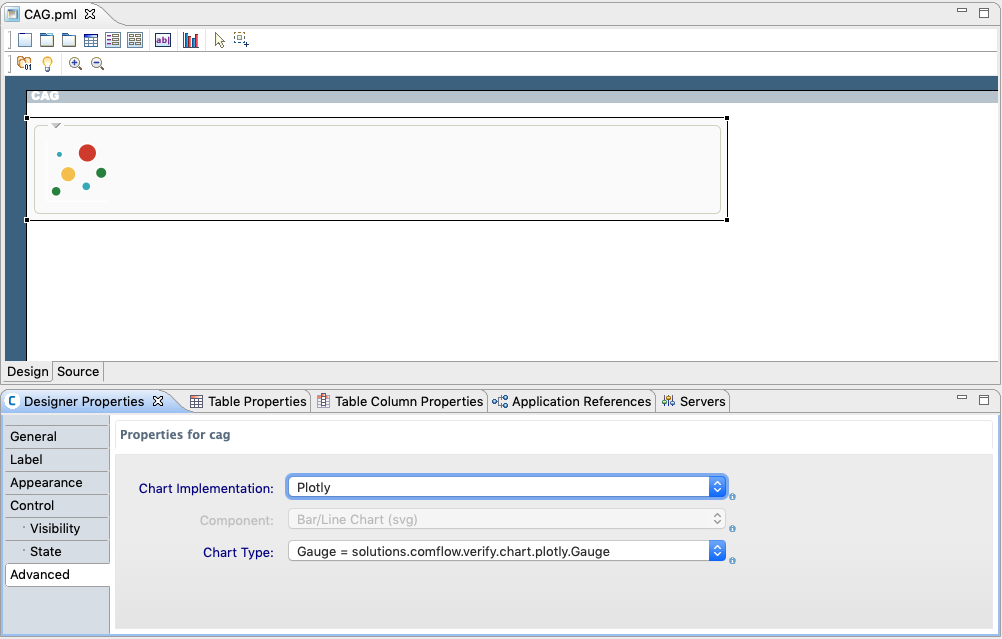
Portlet Designer
Add a CAG segment to your portlet. Go to the Advanced tab in Designer Properties view. The first Chart Implementation combobox option is Classic. Choose Plotly. The Chart Type property is enabled. Choose preferred implementation. The different combobox options point to the class files that were added in the previous section, Eclipse Preferences. Each option is displayed as a combination of the logical name and the implementing full class name. However, the chartType property is set only with the class name.
Now you should be able to run your custom charts. Make sure however to 'hard reload' your browser in order to ensure that necessary resources are reloaded.